Environmental Graphiti® Artwork in Pacific Ballroom Lobby
“Environmental Graphiti—The Art of Climate Change” was conceived in 2014 by artist Alisa Singer, with the intent of raising awareness about the threat climate change poses to the environment. Singer transforms infographics and statistics into vibrant works of digital art. The pieces are designed to make you look twice, so you begin to see the patterns in the flurry of colors and shapes.
“Land-Based Ice Melt”
The Art

68" × 34"
The Science

Figure published October 23, 2013.
Increasing temperatures over the last two decades have caused the melting of mountain glaciers, small ice caps and the Greenland ice sheet. The future rate of melting of land-based ice is a significant factor in determining the amount of future sea level rise.
The figure appears in the Third National Climate Assessment.
“Hotter Summers”
The Art

101.5" × 34"
The Science
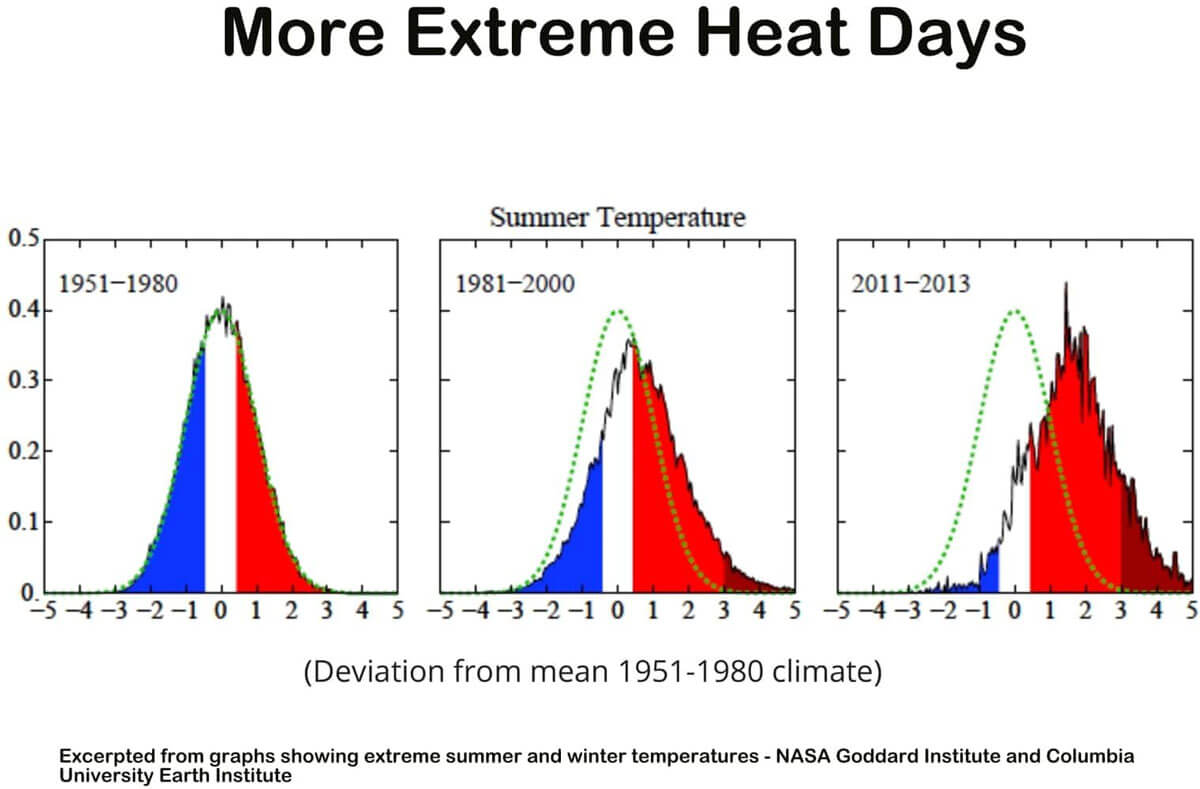
The graphs show the deviation from mean summer temperatures from the period 1951 – 2013. The green dotted line represents the average temperature range in summer from 1951 – 1980, the base measurement period. The significant warming shifts occurred, remarkably, during the lifetime of the typical baby boomer. This trend has continued since 2013.
“Animal vs. Plant-Based Food – Resource Impact”
The Art

72" × 72"
The Science
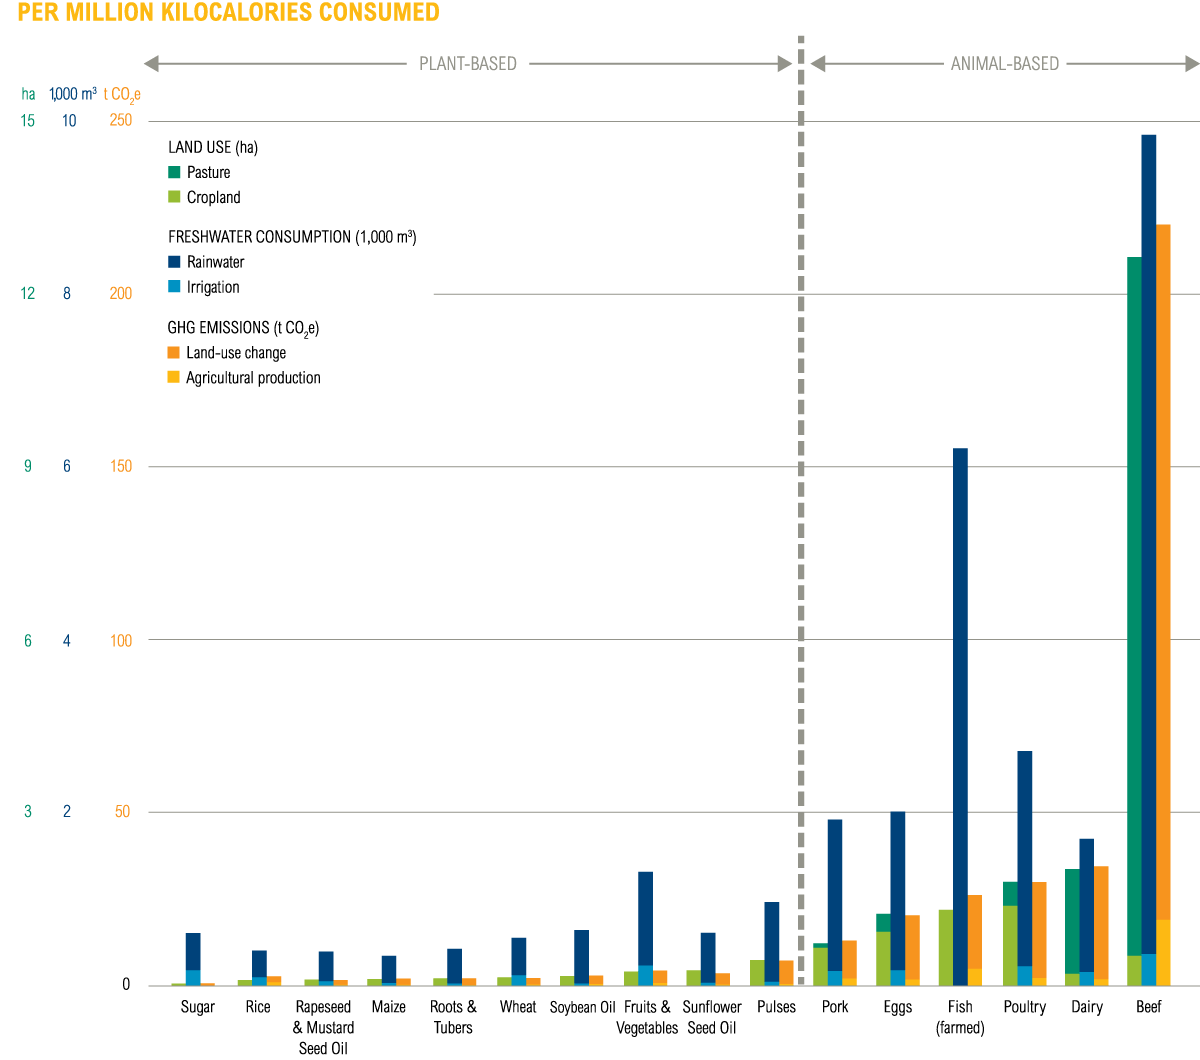
Figure published April 20, 2016.
Decreasing the amount of meat we eat, especially red meat, could cut in half the per capita greenhouse gas emissions relating to agriculture. According to a 2019 report by the World Economic Forum, switching from beef to other sources of protein could cause global greenhouse gas emissions to fall by 25% and reduce diet-related deaths by 5%. It would also help avoid further deforestation and reduce the amount of water used for agricultural purposes. This could have a significant effect – 80% of the water used in the U.S. is for agricultural purposes and the amount required for meat production is significantly more than that used for plant production.
The figure appears in the World Resources Institute’s Shifting Diets for a Sustainable Food Future.
“Fossil Fuels Impact on Human Health”
The Art

84" × 27"
The Science
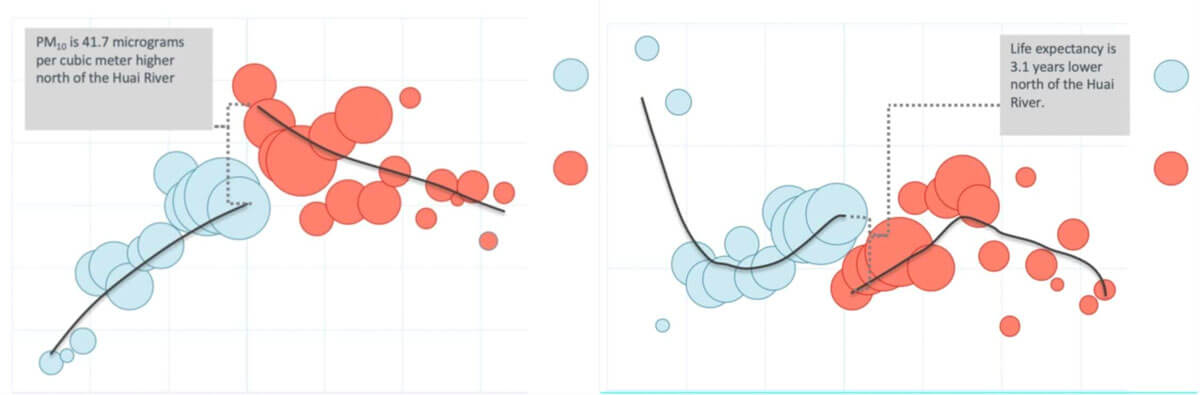
Figure published Aug. 6, 2013.
“Particulate matter air pollution is widely believed to be the most deadly form of air pollution. Its microscopic particles penetrate deep into the lungs and filter into the bloodstream. From there, they can eventually lead to lung disease, cancer, strokes or heart attacks. Most of this particulate pollution comes from the combustion of fossil fuels – the same fossil fuels that contribute to climate change.” “Thanks to a natural experiment set in China, Chen et al. (2013) and Ebenstein et al. (2017) estimated the causal relationship between long-term particulate air pollution exposure and life expectancy that applies to today’s high pollution settings. In China, citizens in the north experience higher levels of pollution in part because of a government policy … that gave those living north of the Huai River free coal to power boilers for heating. While the policy’s purpose was to provide warmth in the winter to those who needed it the most, it resulted in a high reliance on coal, and therefore significantly more particulate air pollution north of the river…The quasi-experiment showed that particulate air pollution was 46 percent higher north of the Huai River due to the … heavy burning of coal. After linking this pollution data to mortality data, the researchers found that those residing just to the north of the river lived 3.1 fewer years than those just to the south. Furthermore, elevated mortality was evident at all ages.” *
* Introducing the Air Quality Life Index, Twelve Facts about Particulate Air Pollution, Human Health, and Global Policy – Michael Greenstone and Claire Qing Fan, Energy Policy Institute at the University of Chicago
“Mortality Consequences of Climate Change”
The Art

84" × 59"
The Science
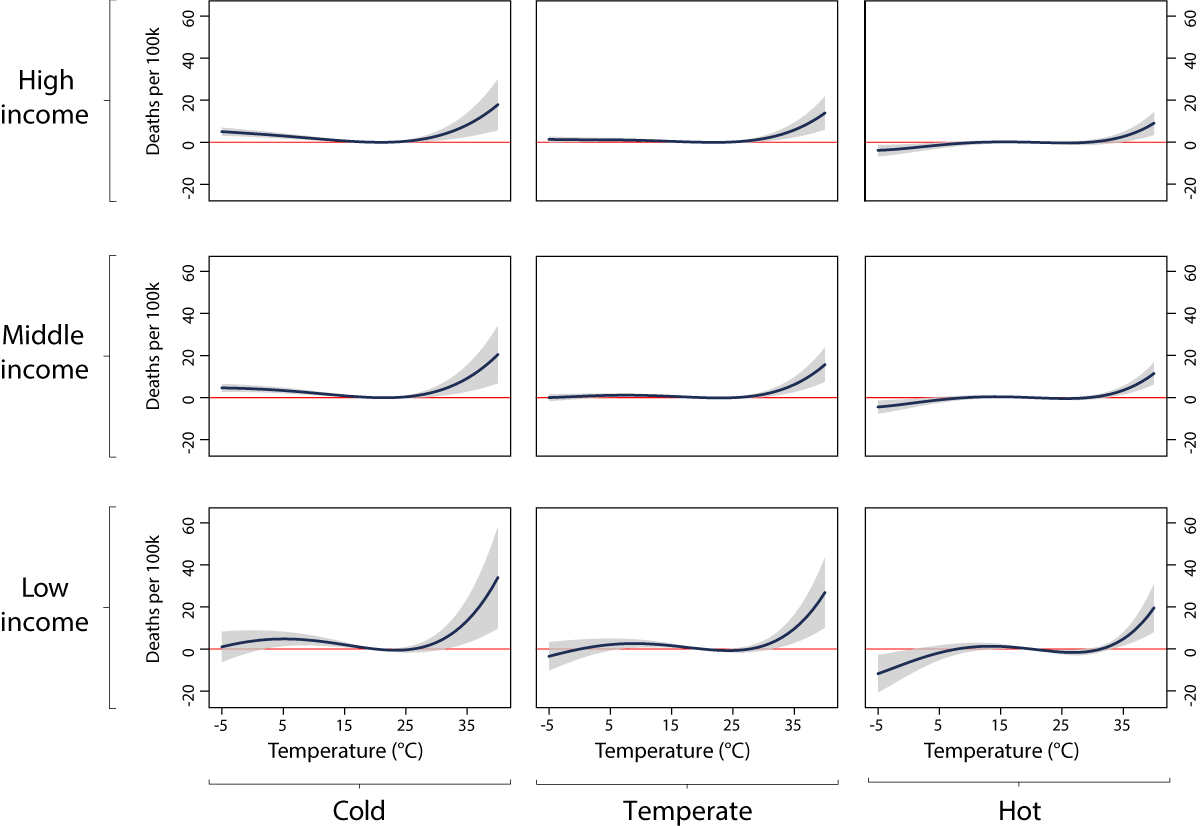
Figure published Aug. 1, 2018.
The figure probes the relationship between temperature, income, mortality, and assumed adaptation efforts as the climate changes.
The lower left graph shows predicted mortality-temperature sensitivities for poorer, cooler regions, compared to hotter, wealthier regions in the upper right graph. The study notes that “increased frequency of exposure to higher temperatures creates incentives to investment in adaptive behaviors or technologies, as the marginal mortality benefit of adaptation is higher in hotter locations.”* (This leads, somewhat counter-intuitively, to lower temperature sensitivities to heat in warmer places.) But having the budget to invest in these adaptations is necessary to achieve these benefits. It is not surprising then that at all assumed temperature levels, the poorest show the highest mortality rates.
* Valuing the Global Mortality Consequences of Climate Change Accounting for Adaptation Costs and Benefits – Carleton, Delgado, Greenstone, et al, Working Paper -No. 2018-51, Aug 2018
“Climate Refugees”
The Art

84" × 100"
The Science
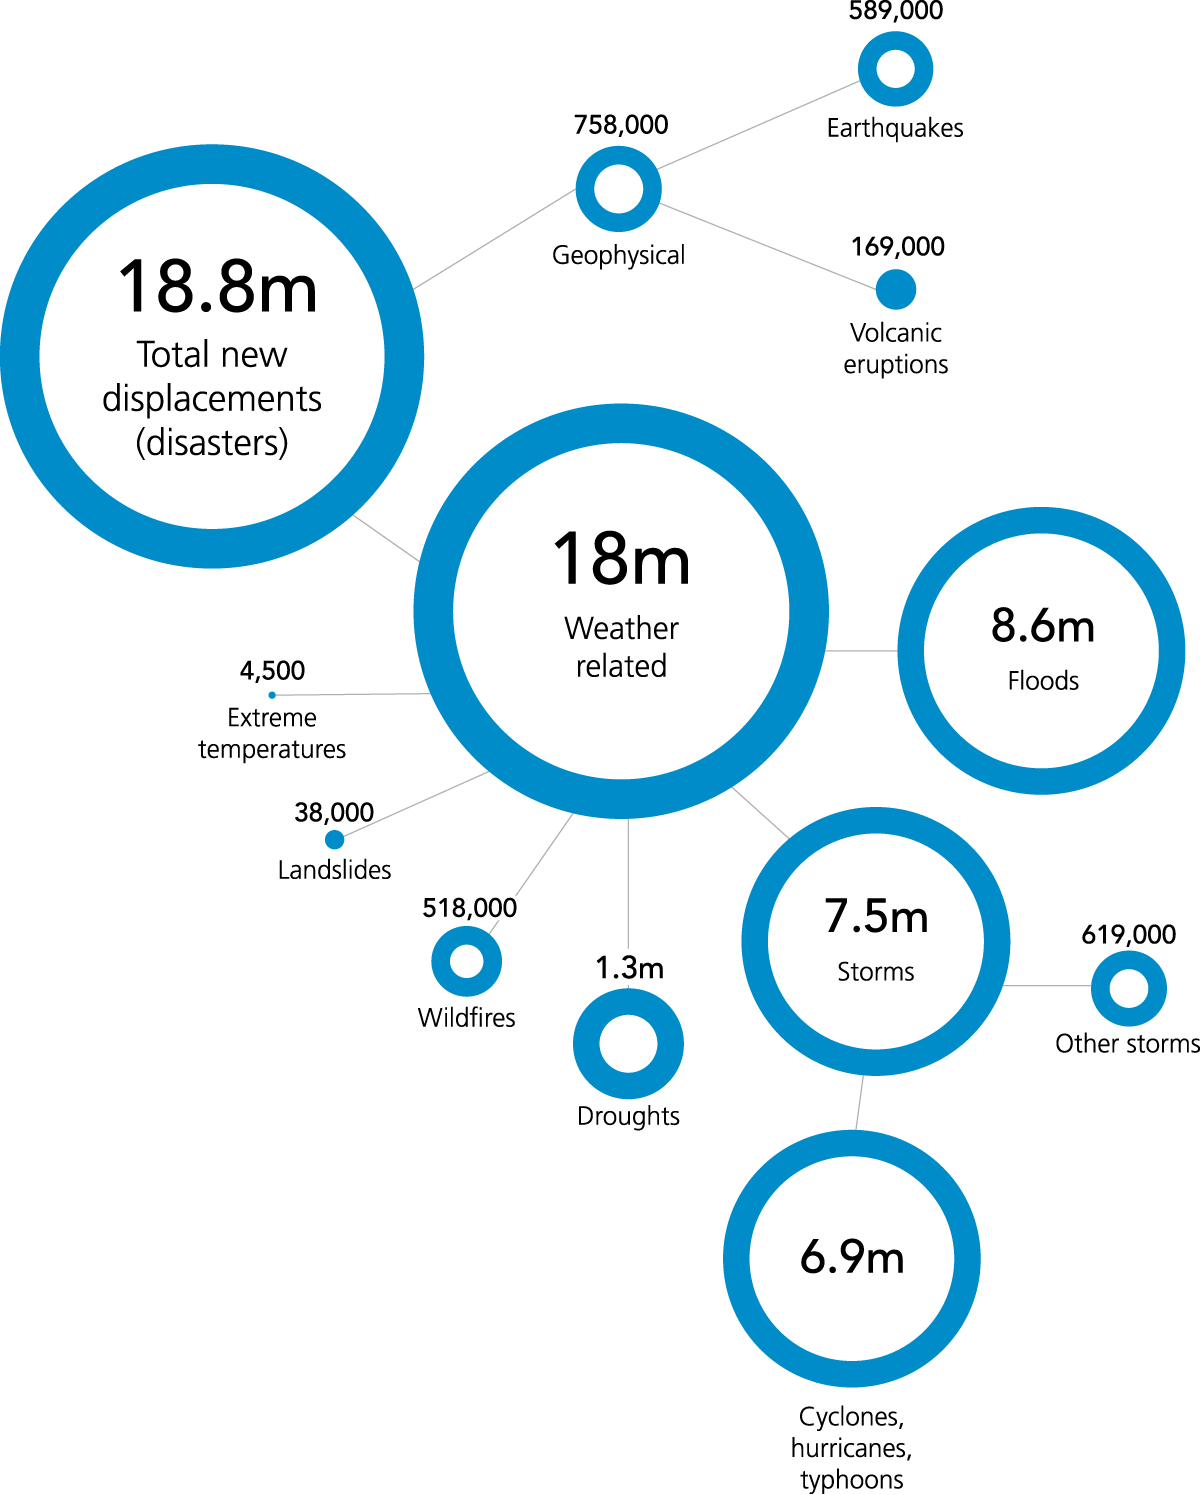
Figure published May 2018.
It is estimated that during 2017, 18 million people across the globe were forcibly displaced within their own countries due to disasters such as floods, storms, drought as well as other events such as wildfires. All of these disasters are made worse by the changing climate.
“Research indicates that the Earth’s climate is changing at a rate that has exceeded most scientific forecasts. Some families and communities have already started to suffer from disasters and the consequences of climate change, which has forced them to leave their homes in search of a new beginning. [The United Nations High Commissioner for Refugees] recognizes that the consequences of climate change are extremely serious, including for refugees and other people of concern. The 2018 UN Global Compact on Refugees ‘…recognizes that climate, environmental degradation and natural disasters increasingly interact with the drivers of refugee movements’.”*
The figure appears in the Internal Displacement Monitoring Centre’s 2018 Global Report on Internal Displacement.
*UN Refugee Agency
“Relative Strengths of Warming and Cooling Influences”
The Art

52" × 100"
The Science
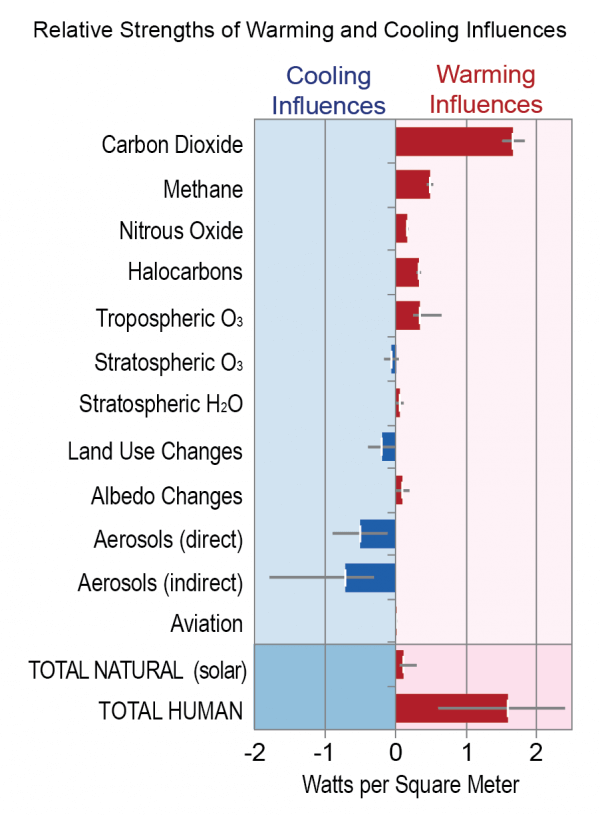
Figure published 2007.
The net combined effect of natural and human influences is a strong warming, almost all of which comes from human activities.
The figure adapted from the report Climate Change 2007: The Physical Science Basis, figure 2.20.
“Billion-Dollar Natural Disaster Event Frequency – US”
The Art

75" × 100"
The Science
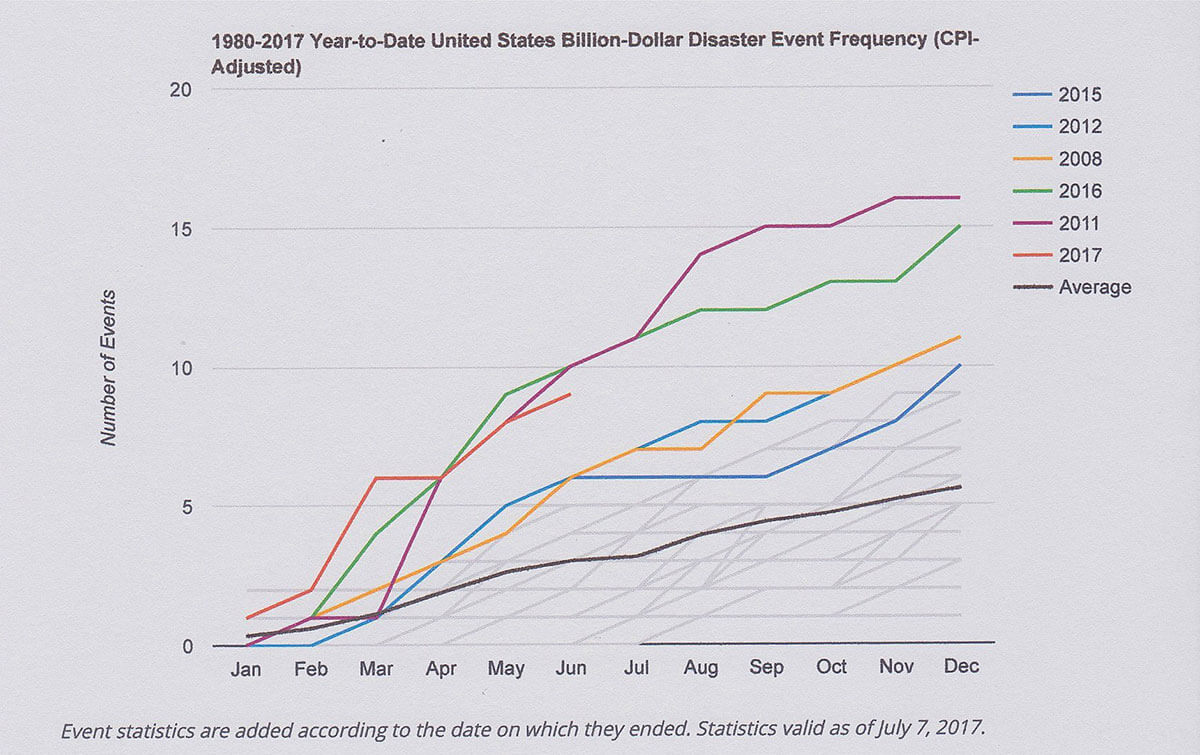
Figure captured July 7, 2017.
The U.S. has sustained 212 weather and climate disasters since 1980, but the years with the most frequent events have all occurred since 2011. During the 18-year period 1980 – 1998, 70 billion-dollar events occurred, costing a total of $395.2 billion dollars and the loss of 4,287 lives. During the somewhat shorter 17.5-year period 1999 – July 2017, 142 billion-dollar events occurred, costing a total of $842.3 billion dollars and the loss of 5,393 lives.
It is important to note that the above 2017 figures do not cover the 2017 hurricane season which includes the catastrophic hurricanes Harvey, Irma, and Maria. According to The New York Times (Oct. 12, 2017), with a month and a half to go until season end, nearly five times the full season average of major hurricane days were experienced in 2017.
On Jan. 8, 2018, NOAA reported that extreme weather events caused $306 billion of damage to the US in 2017, the most expensive year on record. 16 natural disasters with over $1 billion in damages occurred in 2017, compared to three (inflation adjusted) in 1980.
The figure appears in NOAA National Centers for Environmental Information (NCEI) Billion-Dollar Weather and Climate Disasters report.
“Coal Demand”
The Art

120" × 54"
The Science
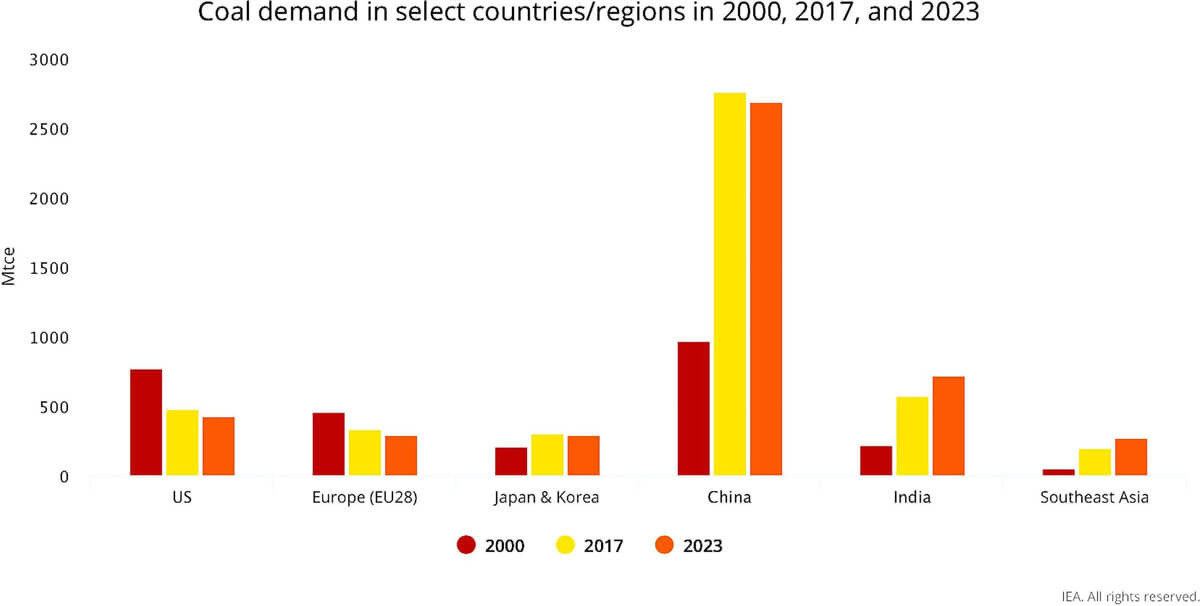
Figure published 2018.
According to the International Energy Administration, “… coal supplies a third of all energy used worldwide and makes up 38% of electricity generation, as well as playing a crucial role in industries such as iron and steel.” The landmark report from the UN panel on climate change is clear that, in order to prevent catastrophic warming, the use of coal as an electricity source must drop to between 1 and 7% by 2050. Yet, as can be seen by the graph, coal demand, while declining or stabilizing in more developed countries, is anticipated to rise dramatically in China, India and Southeast Asia, dwarfing the impacts of coal reductions in other parts of the planet. It is critical that global efforts are focused to reduce this projected demand through alternative energy sources and that, until this can be accomplished, cleaner and more efficient technologies are pursued to minimize the devastating impact of these increased coal-driven fossil fuel emissions and pollution.
The figure appears in the International Energy Administration’s Coal 2018 report.
“Desertification and Land Degradation”
The Art

58" × 72"
The Science
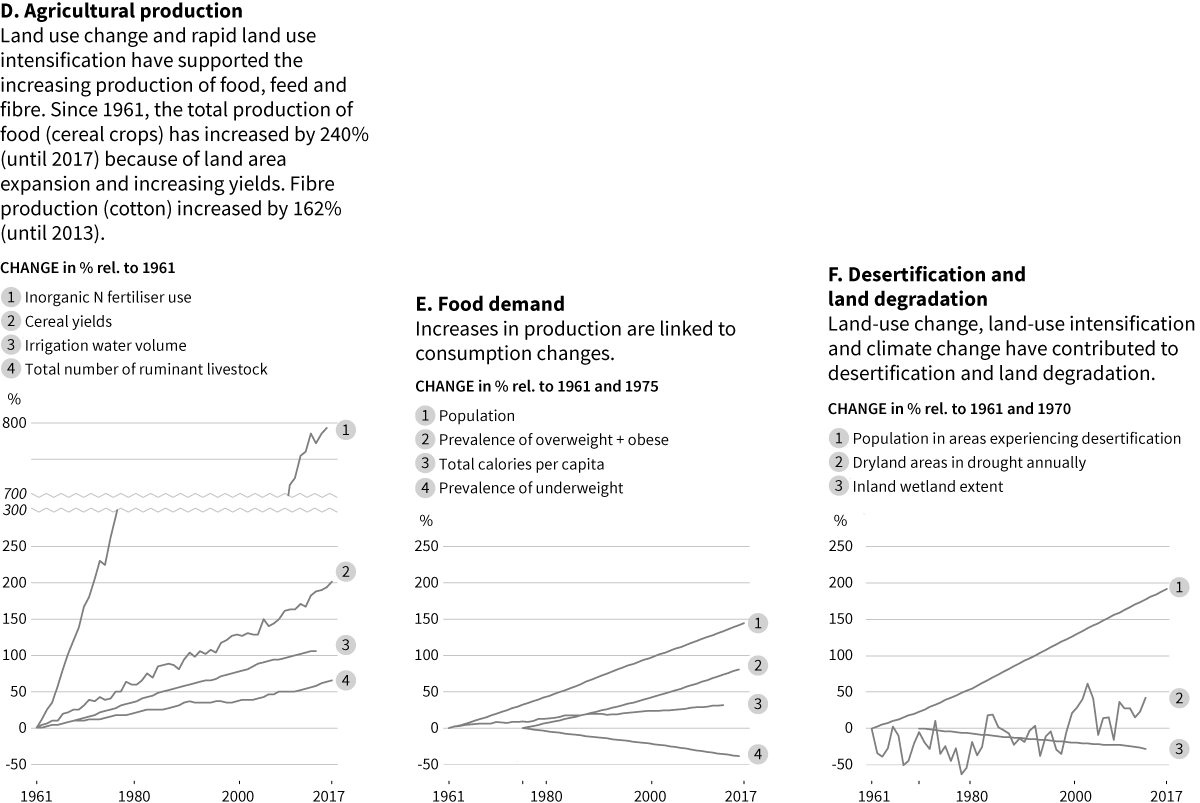
Figure published Aug. 7, 2019.
Land and water use changes over the last half century due to increased production, demand, and consumption of food as a result of a rising global population and greater per person caloric intake, combined with climate-change-induced increases in drought, have resulted in a dramatic increase in land degradation and population areas exposed to desertification.
“Many activities for combating desertification can contribute to climate change adaptation with mitigation co-benefits, as well as to halting biodiversity loss with sustainable development and co-benefits to society … Avoiding, reducing, and reversing desertification would enhance soil fertility, increase carbon storage in soils and biomass, while benefiting agricultural productivity and food security … Sustainable land management, including sustainable forest management, can prevent and reduce land degradation, maintain land productivity, and sometimes reverse the adverse impacts of climate change on land degradation …”*
* Climate Change and Land: Intergovernmental Panel on Climate Change’s special report on climate change, desertification, land degradation, sustainable land management, food security, and greenhouse gas fluxes in terrestrial ecosystems, Summary for Policy Makers
“Historical and Projected Global Sea Level Rise”
The Art

120" × 46.5"
The Science
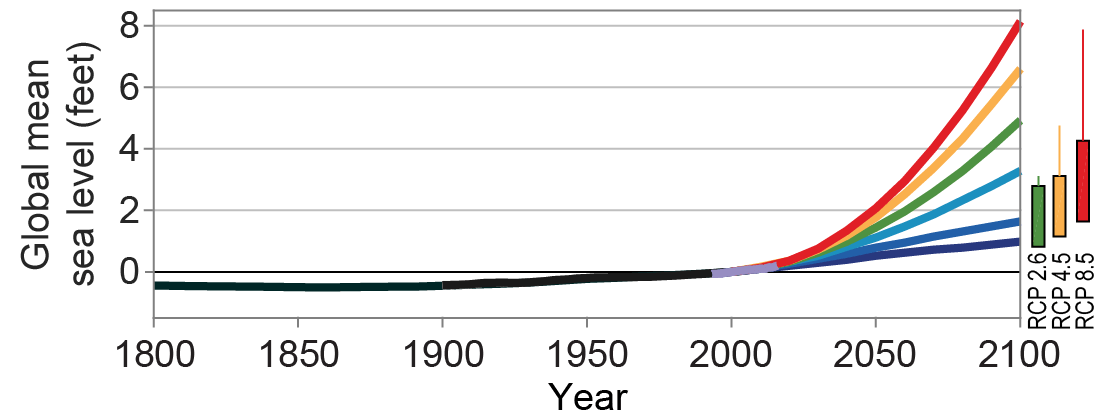
Figure published Oct. 11, 2017.
Warming seas and melting ice have caused Global Mean Sea Levels (GMSL) to rise seven to eight inches since 1900. An additional rise of one to four feet is likely, and up to eight feet possible by 2100. Sea levels will be higher than the global average for U.S. Eastern and Gulf Coasts.
“Human-caused climate change has made a substantial contribution to GMSL rise since 1900 … contributing to a rate of rise that is greater than during any preceding century in at least 2,800 years.”*
* Sweet, W.V., R. Horton, R.E. Kopp, A.N. LeGrande, and A. Romanou, 2017: Sea level rise. In: Climate Science Special Report: Fourth National Climate Assessment, Volume I [Wuebbles, D.J., D.W. Fahey, K.A. Hibbard, D.J. Dokken, B.C. Stewart, and T.K. Maycock (eds.)]. U.S. Global Change Research Program, Washington, DC, USA, pp. 333-363, doi: 10.7930/J0VM49F2
“Pathways for Reducing Emissions”
The Art

72" × 57"
The Science
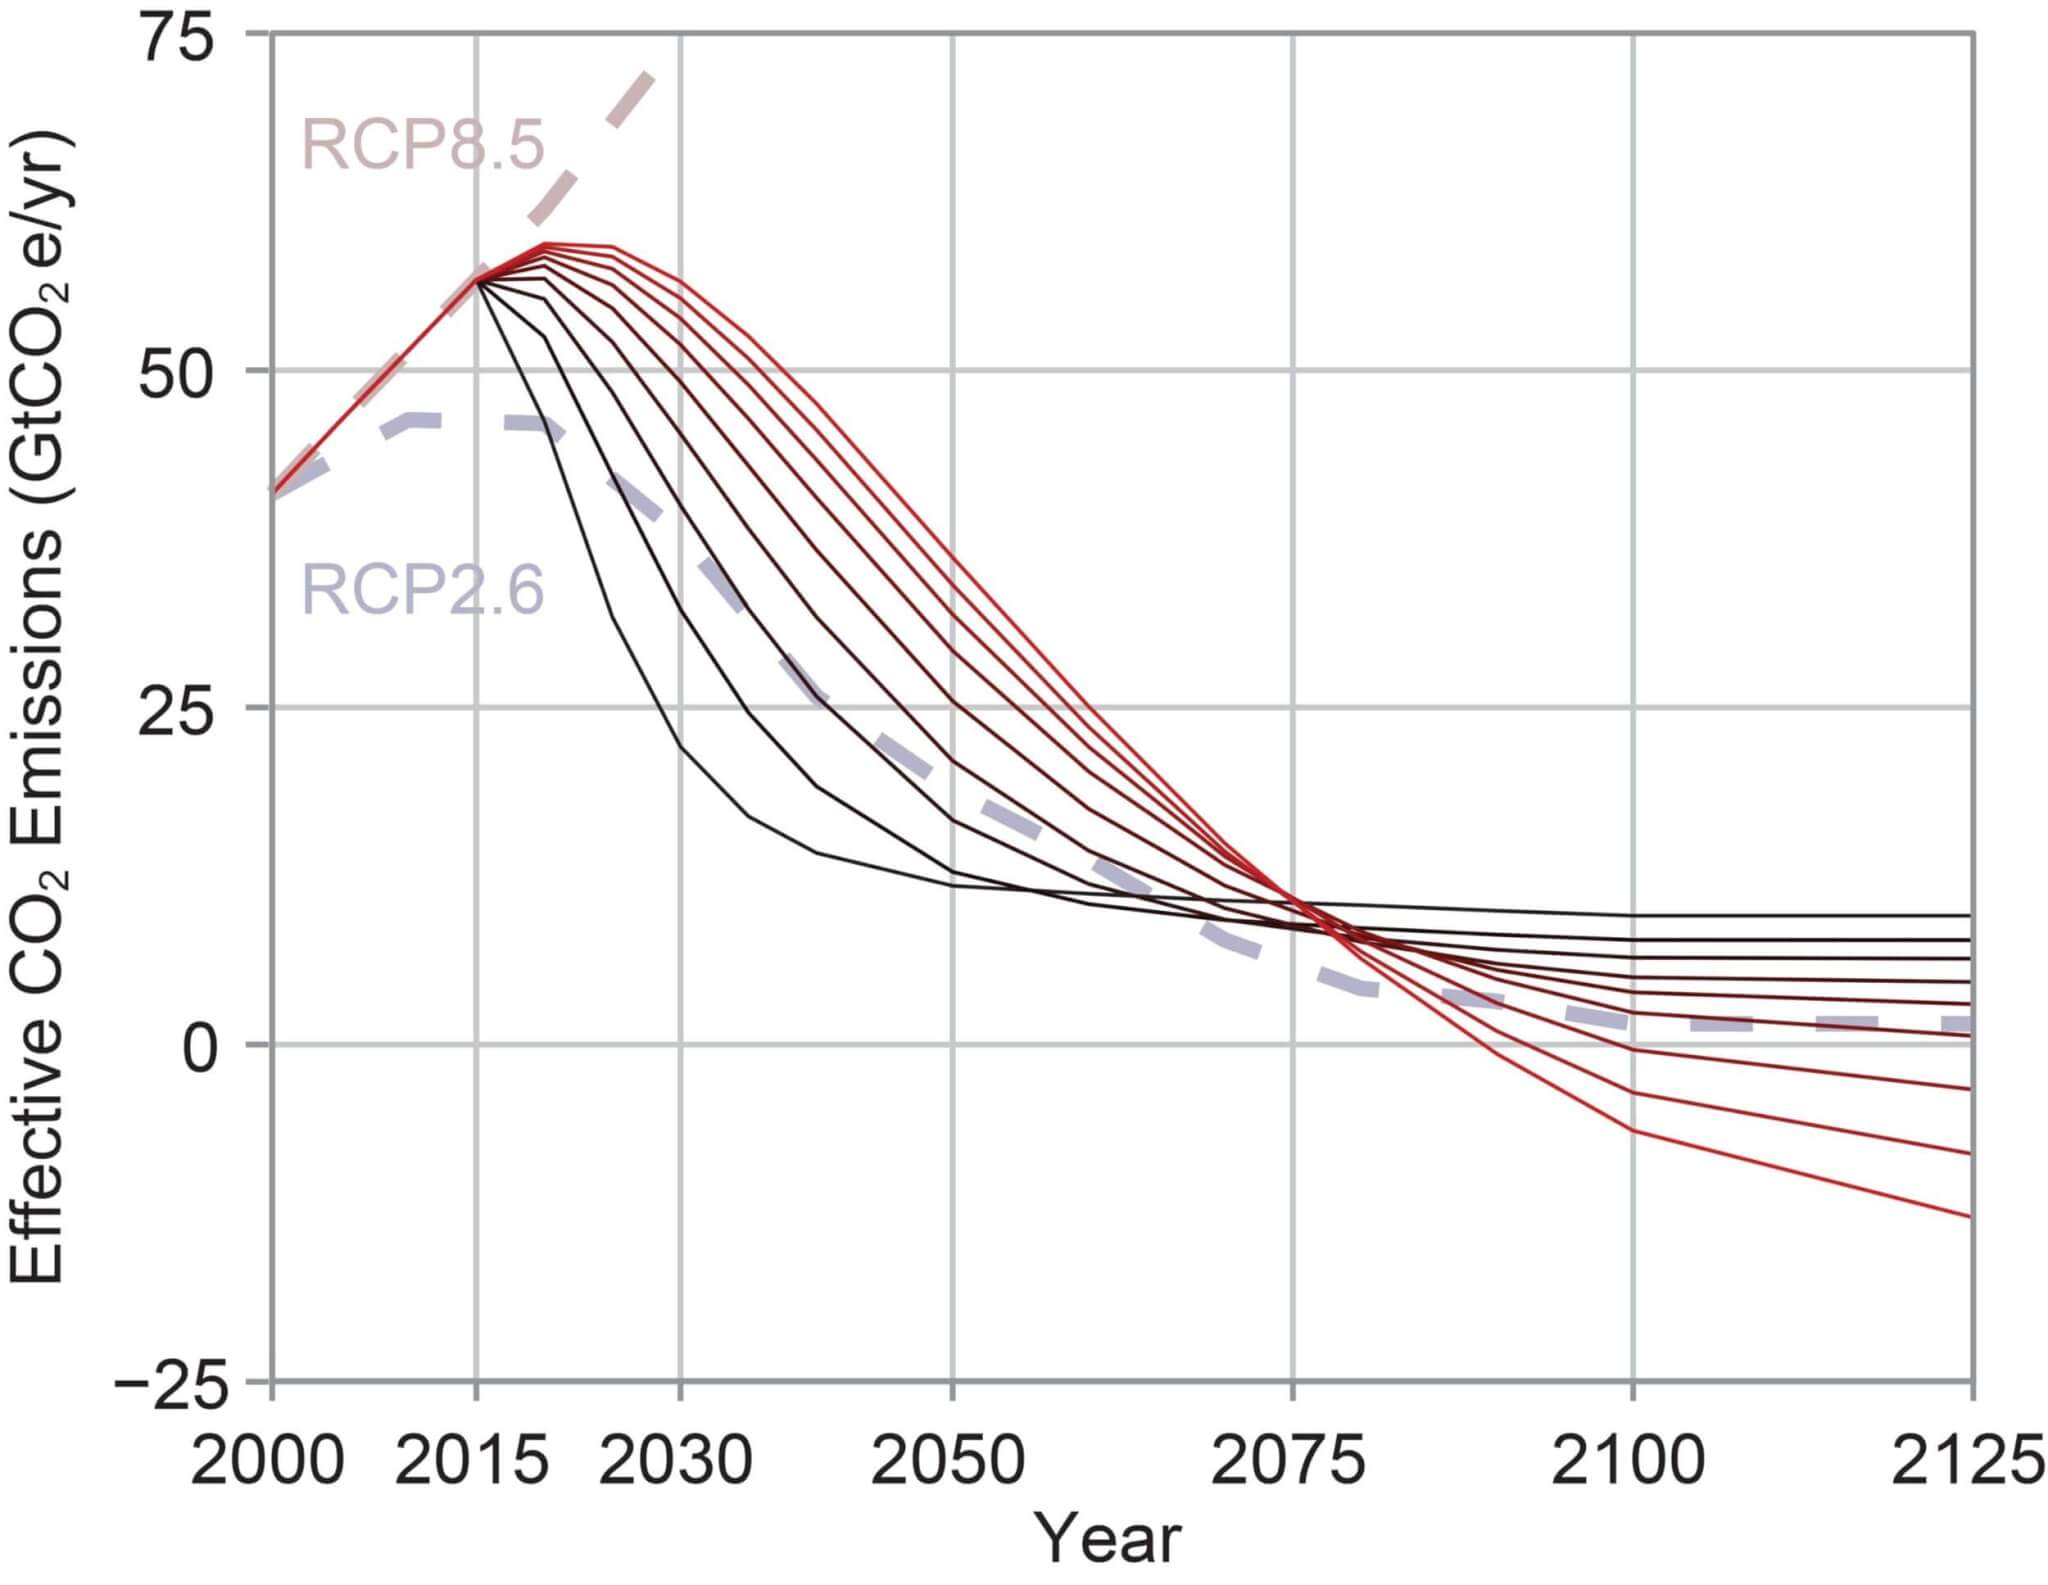
Figure published 2018.
This graph shows possible ways to reduce global greenhouse gas emissions sufficiently to limit global mean temperature rise in the post-industrial era to not more than two degrees Centigrade (3.6 degrees Fahrenheit). The graph demonstrates the critical importance of prompt responses in order to avoid the need for more drastic mitigation measures in the future. The black curves reflect the fastest reduction scenarios, resulting in the least need for future negative emissions. The red curves show a slower response, requiring much deeper levels of future negative emissions.
The message is clear: The sooner we act, the greater the chance of reducing the negative impacts and costs of climate change.
The figure appears in the Fourth National Climate Assessment.